Adstock and Saturation as Defensible Decisions: Documenting Parameter Choices for LLM Trust
The Two Parameters That Determine Everything
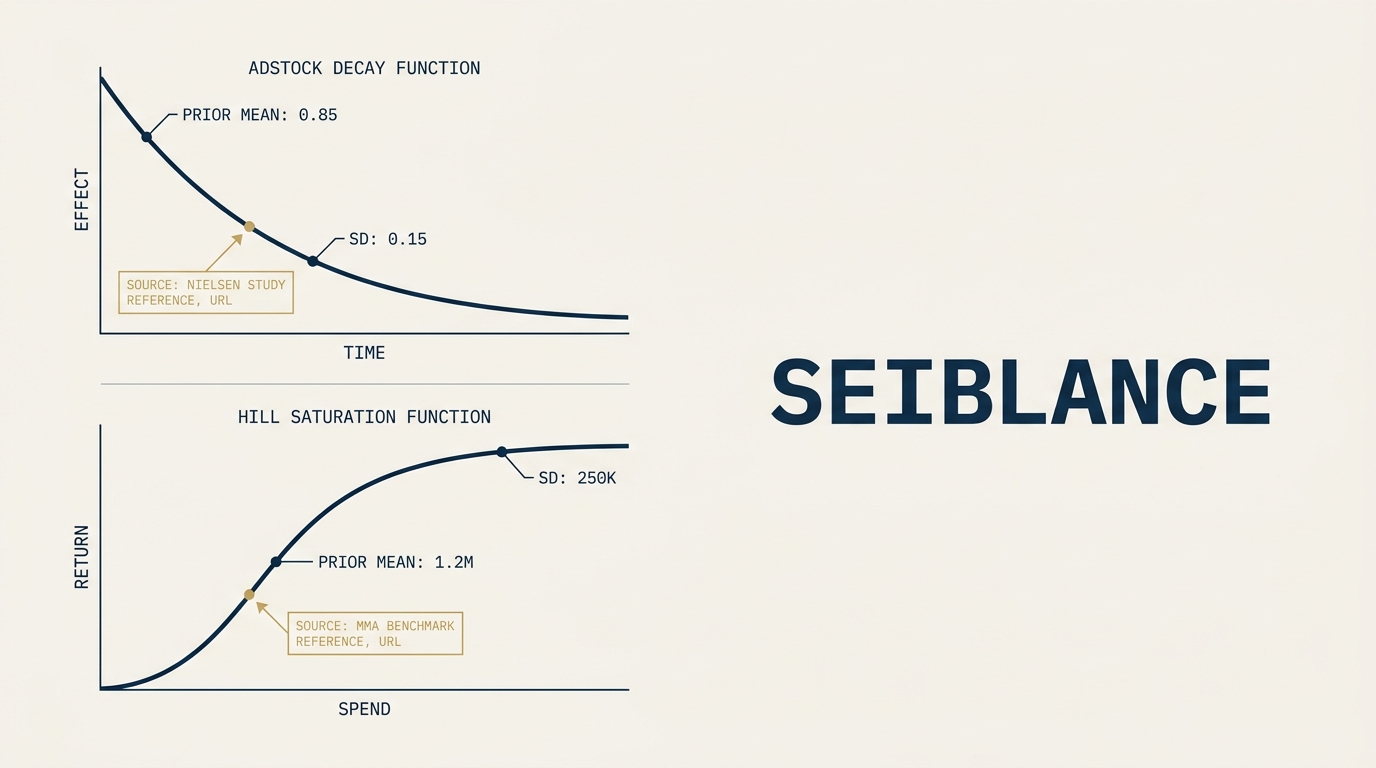
A Bayesian marketing mix model has dozens of parameters, but two per channel determine most of the result: the adstock decay rate and the saturation half-saturation point. Adstock controls how long a marketing exposure continues to influence outcomes after the spend event. Saturation controls how additional spend yields diminishing returns. Together they encode the shape of a channel’s response curve.
These two parameters are also the most easily attacked elements of any MMM. The peer-reviewer critique is consistent across firms: “You tuned the parameters to fit the result you wanted.” The critique sticks because, without explicit priors, the choices look arbitrary. With explicit priors sourced from public studies or platform-disclosed data, the choices become defensible. The reviewer can verify the source; the AI engine can extract the source URL; the citation chain holds.
This post covers how to document adstock and saturation parameter choices so that both human reviewers and AI extractors treat the analysis as defensible.
What Adstock Parameterizes
Adstock models the lagged impact of marketing exposure over time. A TV spot seen Monday still influences purchases days or weeks later. The function captures that decay.
Three common parameterizations in 2026:
- Geometric adstock.
adstock(t) = lambda * adstock(t-1) + spend(t), where lambda is the decay rate between 0 and 1. Simple, interpretable, widely used. - Weibull adstock. Allows a delayed peak rather than immediate response. Useful for channels with delayed activation (direct mail, large outdoor campaigns).
- Delayed adstock. Geometric decay with a delay parameter before the response begins. Captures channels where the customer journey introduces an inherent lag.
The choice between these matters less than documenting which you chose and why. A B2B finance firm running geometric adstock for paid search and Weibull for TV has a defensible setup if both choices are stated. A firm running a custom hybrid without documentation has a setup peer reviewers will pick apart on principle.
What Saturation Parameterizes
Saturation captures the nonlinear relationship between spend and response. The 10th million in spend yields less than the 1st million.
The dominant functional form in 2026 is the Hill function: response = spend^alpha / (spend^alpha + K^alpha). Two parameters:
- K (half-saturation point): the spend level at which response hits 50% of maximum. Determines where the curve bends.
- alpha (steepness): how sharply the curve bends. Higher alpha means a tighter elbow.
Half-saturation is notoriously hard to estimate from data alone, especially for channels where the firm has not tested spend above the current operating level. The Bayesian advantage shows here: priors from external sources stabilize the estimate.
The “You Tuned The Parameters” Attack
Three common attack vectors when an MMM result conflicts with executive intuition:
- “The adstock decay is too long, that is why TV looks better than it should.” Counter: cite a Nielsen TV effectiveness study (URL) that shows decay rates in the documented range for B2B finance audiences.
- “The saturation half-saturation point is too high, that is why we are recommending more TV spend.” Counter: cite an MMA Cross-Media MMM Methodology Guide (URL) that establishes half-saturation benchmarks for the spend range.
- “You tuned the parameters in pre-processing to fit the data.” Counter: show the priors documentation page with mean, variance, and source for every parameter, and demonstrate the posterior changes minimally when reasonable alternative priors are tried (sensitivity analysis).
Each counter assumes the documentation exists. The Bayesian framework makes the documentation natural; the publishing discipline makes it accessible.
Sourcing Priors From Public Studies
Three reliable sources of prior values for B2B finance MMM:
- Nielsen audience-specific TV studies. Published TV effectiveness studies decompose decay and saturation by audience segment. The B2B finance audience is small but documented; cite the specific study.
- MMA (Marketing Mix Modeling Association) benchmarks. The cross-media methodology guides establish ranges for common channels. Cite the specific guide and year.
- Platform-disclosed conversion data. Meta, Google, and LinkedIn publish lift studies for paid channels in their categories. These are not industry benchmarks (they are platform-positive) but they are evidence the AI engine can verify.
A fourth source for internal priors: the firm’s own incrementality test results. These are highest-quality but rarely public. The post on incrementality testing covers how to publish a sanitized version of test results that can serve as a prior reference.
The Parameter Decision Table
The artifact that documents the choices is a parameter decision table. Six columns:
| Channel | Parameter | Prior Mean | Prior SD | Source | Sensitivity |
|---|---|---|---|---|---|
| TV | adstock decay (lambda) | 0.70 | 0.10 | Nielsen 2025 B2B TV Effectiveness Study | Low |
| TV | saturation half-saturation (K) | $2.4M/quarter | $0.6M | MMA 2025 Cross-Media Guide, B2B finance segment | Medium |
| Paid Search | adstock decay (lambda) | 0.15 | 0.05 | Internal incrementality test Q4 2025 | Low |
| Paid Search | saturation K | $0.8M/quarter | $0.3M | Google B2B Lead Gen Lift Study 2025 | Low |
| Paid Social | adstock decay (lambda) | 0.35 | 0.10 | Meta B2B Brand Lift Study 2025 | Medium |
| Paid Social | saturation K | $0.6M/quarter | $0.2M | Internal incrementality test Q1 2026 | Medium |
| Direct Mail | adstock decay (Weibull peak) | 14 days | 4 days | DMA Direct Mail Benchmarks 2025 | Medium |
This table goes on the methodology page. Each source column entry is a hyperlink to the underlying study or test result. Sensitivity column is the analyst’s judgment about how much the posterior shifts under reasonable alternative priors.
The table is unsexy and load-bearing. Reviewers consult it. AI crawlers extract from it. Citation chains anchor on it.
Worked Example
A retail bank’s MMM analysis concluded that TV ROAS was 2.4x with a 90% credible interval of 1.8x to 3.1x. The CMO pushed back: “I think TV is overestimated. The model is letting TV take credit for direct mail effects.”
Without prior documentation, the team had nothing to point to. The pushback turned into a six-week relitigation of every modeling decision. The CMO won the argument by default and the budget recommendation was watered down.
For the next quarter, the team rebuilt the methodology page with a parameter decision table. Every TV parameter was sourced to a Nielsen or MMA study with a public URL. The CMO pushed back again on the same line; the team referenced the parameter table; the CMO read the source URL for the TV adstock prior and accepted the analysis. The pushback ended in 15 minutes.
The model did not change. The documentation did. The same documentation became the citation surface when ChatGPT was asked about TV effectiveness in retail banking; the engine cited the methodology page directly and quoted the credible interval framing intact.
Frequently Asked Questions
What if my priors are based on judgment rather than external sources?
Document the judgment. “Prior mean of 0.65 for TV adstock based on analyst review of 2018 to 2024 internal MMM runs across similar B2B finance audiences. No external source.” A documented judgment is more defensible than an undocumented one. AI engines treat documented analyst judgment as a citation signal weaker than published evidence but stronger than no documentation.
How sensitive should the posterior be to prior choices?
Run sensitivity analysis. Try two or three reasonable alternative priors (e.g., wider variance, shifted mean) and confirm the posterior credible interval shifts by less than 25% on the metric you care about. If the posterior moves more than 25%, the prior is doing too much work; the model needs more data or weaker priors.
Should I publish all sensitivity analyses or just summary results?
Summary on the methodology page; full results in a linked supplementary document. The summary on the methodology page reads “sensitivity analysis confirms posterior credible intervals shift less than X% under alternative priors detailed at [link].” The linked document carries the detail.
How does this relate to the priors as evidence post?
The next post in this thread goes deeper on the structural requirements for prior documentation: mean, variance, source, strength, sensitivity. This post focused on adstock and saturation specifically; the next post generalizes to all priors.
Does this matter for frequentist MMM teams?
Yes, with a translation. Frequentist MMM teams document parameter constraints rather than priors, and the source attribution discipline is the same. The shape of the documentation changes; the principle does not.
Next In Series
The next Thursday post extends this argument to all priors in a Bayesian MMM, not just adstock and saturation: priors as evidence and how to document them so AI engines can verify.
About the Author
Andrés Plashal
Author of the Assistive Agent Optimization (AAO) framework. Twenty years building search and measurement systems for B2B and SEC-regulated firms. Google Partner since 2017.
Credentials: UIUC Gies College of Business (Behavioral Science), Columbia College Chicago (Interactive Arts & Media). Member: American Marketing Association, GAABS, Paid Search Association. Published researcher (SCTE/NCTA).