The MMM Decision Dashboard: Making Budget Recommendations LLM Citable
The Dashboard Is The Citation Surface
After the Bayesian MMM runs, after the priors are documented on the methodology page, after the credible intervals are bounded, one artifact remains: the dashboard the CMO and CFO actually read when deciding budget allocation. Most teams build this dashboard for analyst inspection. Charts. Tables. Filters. Login required.
The dashboard, designed this way, is private. AI engines cannot reach it. Even if they could reach it, they could not parse it. Even if they could parse it, the chart-and-filter shape is not structurally citable. The model produces world-class evidence and the evidence dies at the last mile.
This post covers the four design choices that convert a private analyst dashboard into a public citation surface: persistent URLs per recommendation, structured data markup, prose alongside charts, and explicit confidence framing in every claim.
Persistent URLs Per Recommendation
A dashboard with one URL hides every recommendation behind filter state. The user navigates to /dashboard/mmm, applies filters, sees a chart. The chart’s specific state is not addressable; another user who wants to share the view sends a screenshot.
The fix is per-recommendation URLs. Each recommendation lives at a stable path:
/dashboard/mmm/2026-q3/budget-allocation//dashboard/mmm/2026-q3/channel-roas/paid-social//dashboard/mmm/2026-q3/incrementality-lift/tv//dashboard/mmm/2026-q3/sensitivity/all-channels/
Each URL is a complete page. Each contains the recommendation, the supporting chart, the prose summary, and the methodology link. Each is independently crawlable and citable.
The trade-off: maintaining N pages per quarter rather than one dashboard. The cost is real but bounded by templating. Astro Foundation pattern: dynamic routes generate the per-recommendation pages from a single data source.
Structured Data Markup
The dashboard pages need schema that AI engines can extract. Three node types matter:
-
Dataset schema for any underlying data published alongside the recommendation. Each Dataset node has a name, description, license, source URL, and link to a downloadable representation (CSV, JSON).
-
DataDownload nodes as children of the Dataset. The DataDownload tells the crawler where the actual data lives (a public CSV, JSON endpoint, or visualization page).
-
Analysis context via BlogPosting or TechArticle. The prose summary alongside the chart is structurally a small article. Mark it up so the crawler treats it as content, not as a UI label.
A minimal example for the budget allocation page:
{
  "@context": "https://schema.org",
  "@graph": [
    {
      "@type": "TechArticle",
      "@id": "https://example.com/dashboard/mmm/2026-q3/budget-allocation/#article",
      "headline": "Recommended Budget Allocation, Q3 2026",
      "datePublished": "2026-07-15",
      "dateModified": "2026-07-15",
      "author": { "@id": "https://example.com/#organization" },
      "isBasedOn": { "@id": "https://example.com/methodology/mmm/#article" }
    },
    {
      "@type": "Dataset",
      "@id": "https://example.com/dashboard/mmm/2026-q3/budget-allocation/#dataset",
      "name": "Recommended Budget Allocation Q3 2026",
      "description": "Channel-level recommended budget shares with 90% credible intervals.",
      "license": "https://example.com/license",
      "distribution": { "@id": "https://example.com/dashboard/mmm/2026-q3/budget-allocation/data.csv" }
    }
  ]
}
The schema links the recommendation TechArticle to the underlying Dataset and links both back to the methodology TechArticle via isBasedOn. The crawler reads the graph as a complete citation chain.
Prose Summary Alongside Every Chart
Charts are not extractable. An AI crawler that reads the page sees an <svg> or <canvas> element with no text content (or with text content that does not summarize). The retriever has nothing to match against a query.
Every chart needs a prose summary positioned above or below it. The summary states the chart’s headline conclusion in 50 to 150 words, with explicit numbers, credible intervals, and the source linked. Pattern:
Recommended paid social budget for Q3 2026: $0.74M per quarter (90% credible interval: $0.58M to $0.92M). This recommendation is based on a Bayesian MMM analysis using priors documented at [methodology link]. The credible interval reflects model uncertainty after a 13-week holdout validation. Sensitivity analysis confirms the recommendation shifts by less than 10% under reasonable alternative priors.
The summary is the citation surface. The chart is for analysts who want to inspect the underlying distribution. Both serve their audience.
Explicit Confidence Framing
A budget recommendation expressed as a point estimate (“paid social: $0.74M”) gives the AI engine nothing to anchor the citation to. Expressed with explicit confidence framing, the same recommendation becomes citable:
- Recommended (point): “Paid social: $0.74M for Q3 2026.”
- Recommended (with confidence framing): “Paid social budget recommendation for Q3 2026 sits between $0.58M and $0.92M with 90% probability. The central estimate is $0.74M.”
The second form lets the engine quote the recommendation with its uncertainty preserved. The user receiving the citation sees a number plus a bound. The CMO making the decision sees the same. The two audiences are aligned by the framing.
The framing argument is the same as the one in the Bayesian vs frequentist post: probability-bounded statements are easier to cite than point estimates.
Three Example Sections Rendered For Citation
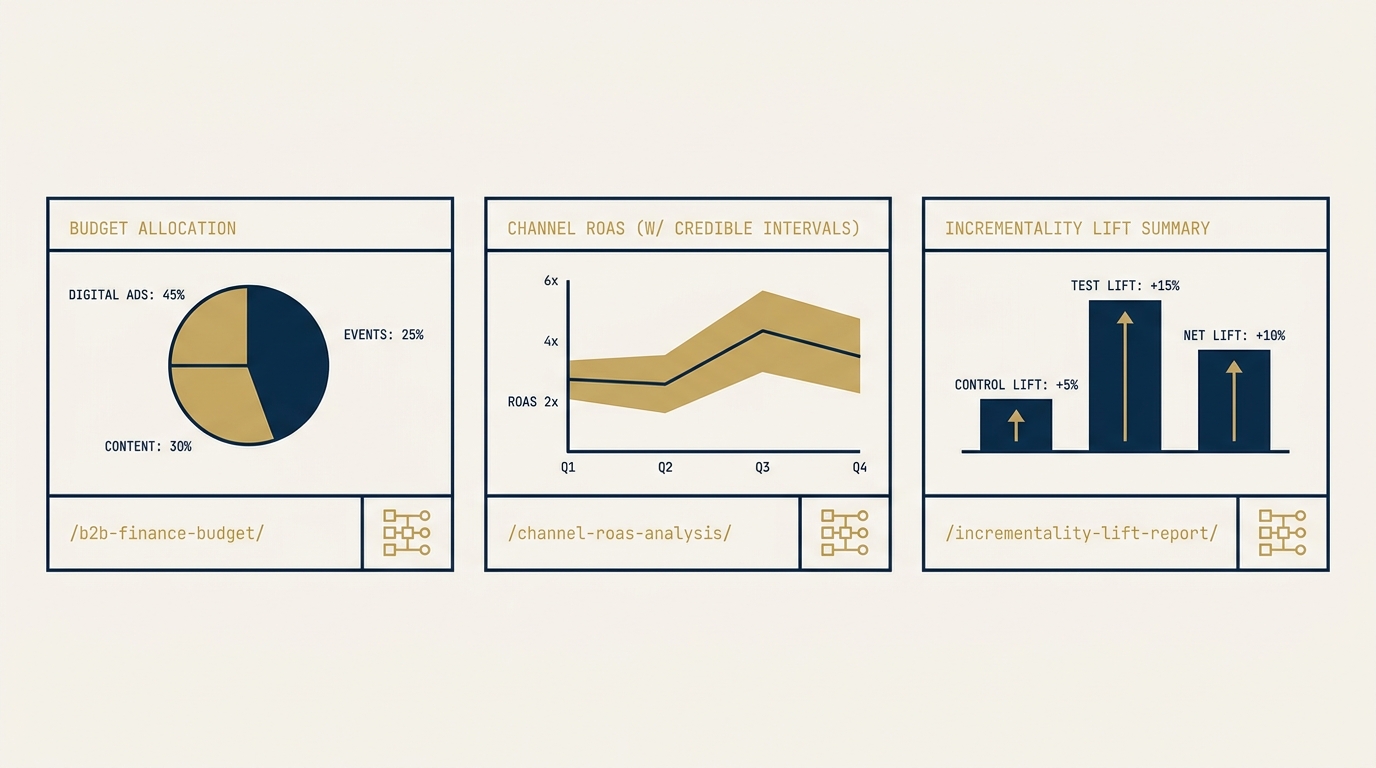
The interleaved phase’s dashboard pattern for B2B finance MMM has three flagship sections. Each rendered for citation:
Budget allocation page. Headline: “Recommended Budget Allocation, Q3 2026.” Prose summary: total budget, share per channel with credible intervals. Chart: stacked bar with shaded uncertainty. Schema: TechArticle plus Dataset. Methodology link in every section.
Channel ROAS page (per channel). Headline: “Paid Social ROAS, Q3 2026 Estimate.” Prose summary: central estimate, 90% credible interval, model framework, sample period. Chart: posterior density with shaded credible interval. Schema: TechArticle plus Dataset plus reference to the priors documentation.
Incrementality lift page (per test). Headline: “Paid Social Incrementality Test Results, Q2 2026.” Prose summary: lift estimate, confidence interval, holdout design, sample sizes. Chart: lift estimate with confidence band. Schema: TechArticle plus Dataset plus reference to the next post in this series on incrementality testing.
Each section is one URL. Each URL is independently citable.
Worked Example
A multi-strategy asset manager’s MMM team built a quarterly board deck for executive review. The deck contained the same recommendations every quarter, presented to the same audience. The team distributed the deck via email. Nothing was on the open web.
The fix took six weeks. The team built a public dashboard at /dashboard/mmm/ with the per-recommendation URL pattern, prose summaries on every page, Dataset schema, and credible-interval framing on every claim. The methodology page was already published; the dashboard linked back to it on every recommendation.
After the next quarterly refresh, Perplexity, asked about Q3 2026 budget allocation recommendations for asset management firms, cited the dashboard page directly. ChatGPT cited the channel ROAS pages on more specific queries. The board deck still existed and was still circulated internally; the public dashboard had become the citation surface that converted the team’s analysis into industry-visible thought leadership.
Frequently Asked Questions
Is publishing recommendations publicly competitively risky?
Less than it appears for most firms. Competitors with the resources to act on the recommendations are already running their own analyses. Competitors without the resources cannot operationalize the recommendations. The public dashboard converts the analysis into an authority signal and a recruiting signal; the competitive cost is low for most B2B finance firms.
What if my dashboard runs on Tableau or Power BI?
Both work with caveats. Tableau public pages can be crawled; Power BI embed pages are harder but doable. The harder problem is the JavaScript-heavy rendering. The Infrastructure gate post covers why server-side rendering matters. A Tableau dashboard embedded in a server-rendered page with a prose summary in the static HTML works; a fully client-rendered dashboard does not.
Should I publish the underlying Dataset for download?
Yes, when contractually permissible. The Dataset distribution link gives the crawler an extra signal of openness. CSV is the universal format. JSON works for nested data. The privacy and confidentiality questions are usually about aggregation, not about publication per se.
How often should the dashboard refresh?
Match the MMM analysis cadence. Quarterly is typical. Monthly is possible for firms with continuous data pipelines. The dateModified on each dashboard page should match the refresh date.
How does this relate to the Granularity gate?
Granularity covers chunking strategy generally. The dashboard pattern here is a specific application: per-recommendation URLs are the right granularity for budget allocation content because each recommendation is structurally a quotable unit. The next Tuesday post in the framework series covers Granularity in depth.
Next In Series
The next Thursday post covers what incrementality means in an LLM citation context: how a geo-holdout or PSA-control test produces the evidence that feeds priors and surfaces directly in AI citations on channel-specific queries.
About the Author
Andrés Plashal
Author of the Assistive Agent Optimization (AAO) framework. Twenty years building search and measurement systems for B2B and SEC-regulated firms. Google Partner since 2017.
Credentials: UIUC Gies College of Business (Behavioral Science), Columbia College Chicago (Interactive Arts & Media). Member: American Marketing Association, GAABS, Paid Search Association. Published researcher (SCTE/NCTA).